
Day 48: Interactive Queries - Building StreamSocial’s Live Trending API
What We’re Building Today
Today we’re exposing the internal brain of our Kafka Streams application to the outside world. You’ll build a REST API that lets anyone query what’s trending on StreamSocial right now—no database required. The same state stores we’ve been using for stream processing become queryable data sources that power real-time dashboards.
High-Level Goals:
Query Kafka Streams state stores via REST API
Build live trending topics endpoint with real-time metrics
Handle distributed state across multiple application instances
Create analytics dashboard showing trending content
Why Interactive Queries Matter in Ultra-Scale Systems
When Twitter shows you “Trending Now” or Netflix displays “Popular Today in Your Area,” they’re not querying traditional databases. Those systems would collapse under the load. Instead, they query the same in-memory state that powers their stream processing—and they do it millions of times per second.
Instagram’s Explore page updates every few seconds based on engagement patterns. LinkedIn’s “People Also Viewed” updates as you browse. Uber’s surge pricing map refreshes constantly. All of these use the same pattern: stream processing builds state, interactive queries expose it.
The breakthrough? Your streaming application becomes both the processor AND the database. No synchronization lag, no eventually consistent reads, no cache invalidation headaches. The state that drives your processing logic is the same state that answers user queries.
Real-World Scale: Netflix queries Kafka Streams state stores to power their real-time recommendation tiles. LinkedIn’s “Who Viewed Your Profile” queries stream processing state across hundreds of application instances. Uber’s dynamic pricing reads directly from Kafka Streams state stores in multiple data centers.
Core Concept: Interactive Queries
Interactive Queries is Kafka Streams’ built-on capability to query state stores from outside the streaming topology. Think of it like this: your streaming application maintains various state stores (KeyValue stores, Window stores, Session stores) to track aggregations, joins, and transformations. Interactive Queries lets you read from these stores via normal application code—typically through REST endpoints.
The magic happens because state stores are already in-memory, already partitioned across instances, and already kept up-to-date by the streaming topology. You’re not adding a separate database layer; you’re querying the operational state directly.
How State Stores Become Queryable
Every Kafka Streams application instance knows which partitions it owns and therefore which key ranges live in its local state stores. When you query for a specific key, the Streams metadata tells you which instance has that partition. If it’s local, you read directly. If it’s remote, you make an RPC call to that instance.
This distributed query pattern means each application instance needs to expose a REST endpoint and also maintain metadata about the cluster topology. StreamsMetadata provides discovery—telling you which host:port owns which keys.
State Store Types and Query Patterns
KeyValueStore: Point lookups (get(key)), range scans (range(from, to)), and full scans (all()). Perfect for current values like user profiles or latest engagement scores.
WindowStore: Time-based lookups (fetch(key, timeFrom, timeTo)). Ideal for trending analysis—”what’s the engagement in the last hour?”
SessionStore: Session-based queries for user activity patterns. Great for “active users in the last 30 minutes.”
For StreamSocial’s trending topics, we’ll use a WindowStore that tracks hashtag counts in tumbling windows. Our REST API will query recent windows to calculate what’s trending right now.
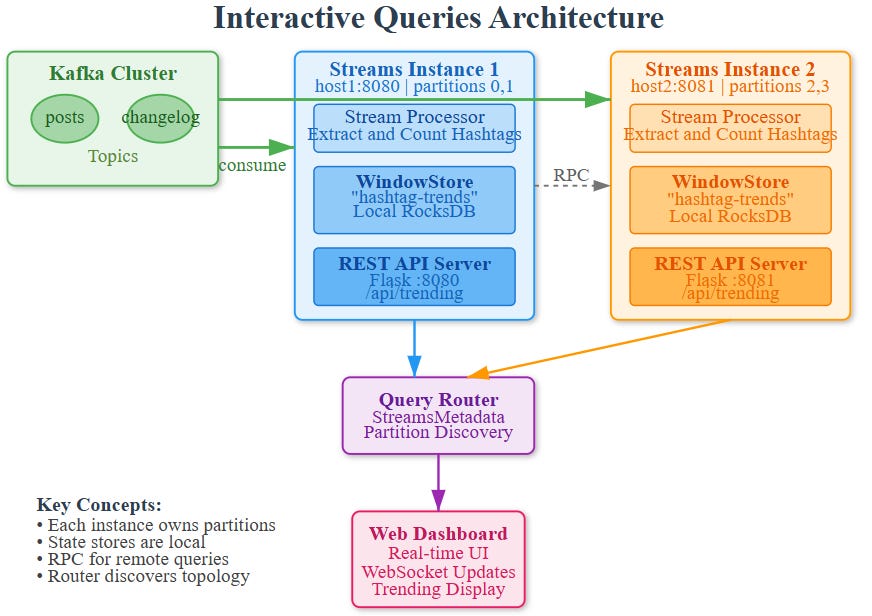
Architecture: StreamSocial Trending Topics System
Components
Kafka Streams Processor:
Consumes posts from
social.poststopicExtracts hashtags and counts them in 5-minute windows
Maintains WindowStore named “hashtag-trends-store”
Each window holds hashtag counts for that time slice
REST API Layer:
Flask application embedded in the Streams instance
Queries local and remote state stores
Aggregates recent windows to calculate trending scores
Returns top N trending topics with metrics
Interactive Query Router:
Discovers which instance owns which state
Routes queries to correct instance
Handles network failures and retries
Aggregates results from multiple windows
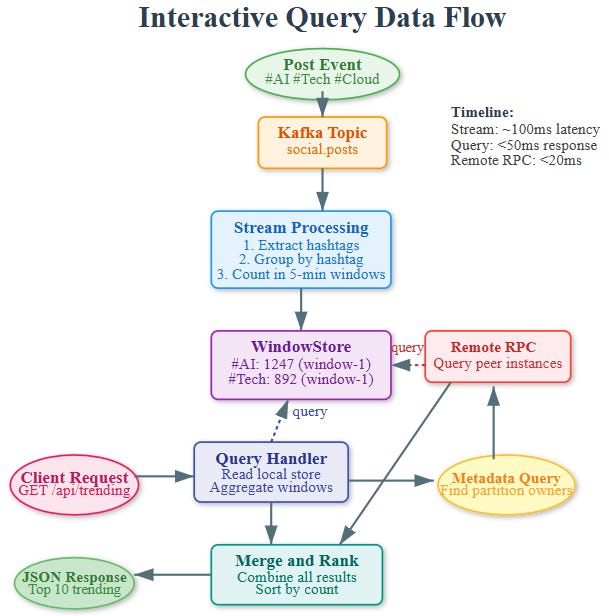
Data Flow
Stream Processing: Posts arrive → hashtags extracted → counted in windows → stored in local state
Query Request: Client calls
/api/trending→ REST handler receives requestMetadata Lookup: System checks which instances own which partitions
Local/Remote Query: If local, read directly; if remote, HTTP call to peer instance
Aggregation: Combine counts from last N windows to rank trends
Response: Return top trending hashtags with counts and velocity
Distributed Query Coordination
The tricky part: your state is partitioned. If you have 3 application instances, each owns 1/3 of the partitions. A query for “all trending topics” needs to:
Query metadata to discover all instances
Make parallel HTTP requests to each instance for their local state
Merge and rank results across all instances
Return unified view to client
This is why each instance runs both a Streams application AND a REST server. They’re peers in a cluster, each serving queries for their partition slice.
Production Patterns from Big Tech
Netflix Approach: They run hundreds of Kafka Streams instances, each exposing gRPC endpoints for state queries. Their recommendation system queries these endpoints to blend real-time viewing patterns with cached recommendations.
LinkedIn Technique: Interactive queries power their “Recently Viewed” features. They use consistent hashing to route queries and implement aggressive caching at the edge to handle query spikes.
Uber’s Pattern: Dynamic pricing queries Kafka Streams state across regions. They implement tiered queries—hot data from Streams state, warm data from Redis, cold data from databases.
Handling Query Hotspots
Some keys get queried way more than others (celebrity profiles, viral posts). Solutions:
Local caching: Add an in-memory cache in front of state store queries
Read replicas: Kafka Streams supports standby replicas that can serve read-only queries
Query aggregation: Batch multiple client requests into single state store queries
Consistency Guarantees
Interactive queries read committed state—data that’s been successfully processed and checkpointed. However, there’s a small window (seconds) where new data is in-flight. For most real-time analytics, this is acceptable. For critical consistency needs, query the Kafka topic directly or add timestamp metadata.
Progressive Learning: Hands-On Implementation
This guide walks you through building StreamSocial’s Trending Topics API with Kafka Streams Interactive Queries. Learn by doing—each step builds on the previous one.
Phase 1: Project Setup & Infrastructure
Github Link:
https://github.com/sysdr/streamscial/tree/main/day48/day48-interactive-queriesStep 1: Create Project Structure
bash
cd ~/day48-interactive-queries
mkdir -p src/{streaming,api,web} tests config data/state-stores logs
What you’re building: A distributed query system where each component serves a specific role—streaming processes data, API exposes queries, web displays results.
Step 2: Start Kafka Infrastructure
bash
docker-compose up -dWait for readiness:
bash
# Check if Kafka is ready (should see broker)
docker-compose ps
Expected Output: Services zookeeper and kafka running with “Up” status.
Concept: Kafka runs in Docker for consistent development environment. Production would use managed clusters.
Phase 2: Understanding WindowStore
Core Concept: State Stores as Queryable Data
Traditional approach: Stream processing → Database → Query database Interactive Queries: Stream processing → Query state directly
WindowStore Structure:
Key: “hashtag:window_timestamp”
Value: count
Example: “ai:1700000000000” → 47
Pseudo-code for WindowStore:
python
class WindowStore:
    def put(key, value, timestamp):
        window_start = calculate_window(timestamp)
        composite_key = f”{key}:{window_start}”
        rocksdb.store(composite_key, value)

    def fetch(key, time_from, time_to):
        # Return all windows for key in time range
        return [(window, count) for each matching window]
Phase 3: Building the Streaming Processor
Step 3: Install Dependencies
bash
source venv/bin/activate
pip install kafka-python rocksdict sortedcontainers flask flask-socketio
Key Libraries:
rocksdict: Local RocksDB storage for state
kafka-python: Kafka consumer/producer
flask-socketio: Real-time WebSocket updates
Step 4: Understand the Processing Logic
Stream Processing Flow:
Consume post from Kafka
Extract hashtags using regex:
#(\w+)Calculate current window:
(timestamp / window_size) * window_sizeIncrement count in WindowStore
Continue...
Window Calculation Example:
timestamp: 1700000000000 (arbitrary ms)
window_size: 300000 (5 minutes)
window_start: (1700000000000 / 300000) * 300000 = 1699999500000

Result: All events in 5-minute window share same window_start
Step 5: Launch Streaming Processor
bash
python src/main.py 0Expected Output:
[Instance 0] Started processing on port 8080
Starting API server on port 8080...
Dashboard: http://localhost:8080/web/dashboard.html
What’s happening: Application starts both processor AND REST API in same JVM (process). This is key to Interactive Queries—the API queries local state stores.
Phase 4: Interactive Query API
Concept: Distributed State Queries
Challenge: State is partitioned. Instance 1 has partitions 0,1. Instance 2 has partitions 2,3.
Query Pattern:
Client calls
/api/trendingon Instance 1Instance 1 queries its local store (fast)
Instance 1 discovers peer Instance 2 via metadata
Instance 1 makes HTTP call to Instance 2 (RPC)
Instance 1 merges results
Returns unified view to client
Step 6: Test Health Endpoint
bash
curl http://localhost:8080/api/health | jqExpected Response:
json
{
  “status”: “healthy”,
  “instance”: {
    “instance_id”: 0,
    “host”: “localhost”,
    “port”: 8080,
    “state”: “RUNNING”
  },
  “timestamp”: 1700000000000
}
Key Insight: Each instance exposes metadata about itself. This enables peer discovery.
Step 7: Query Empty Trending Topics
bash
curl http://localhost:8080/api/trending | jqExpected Response:
json
{
  “trending”: [],
  “timestamp”: 1700000000000,
  “window_size_minutes”: 5
}
Why empty? No posts yet! Let’s generate some.
Phase 5: Generating Data & Observing Trends
Step 8: Generate Posts with Hashtags
Open new terminal:
bash
source venv/bin/activate
python src/post_generator.py
Expected Output:
Starting post generator...
Generating posts with trending hashtags...
Generated 10 posts...
Generated 20 posts...
What’s happening: Posts contain weighted hashtags (#AI appears more often than #Blockchain). This simulates real-world trending patterns.
Step 9: Watch Trends Appear (30 seconds later)
bash
curl http://localhost:8080/api/trending | jqExpected Response:
json
{
“trending”: [
{
“hashtag”: “ai”,
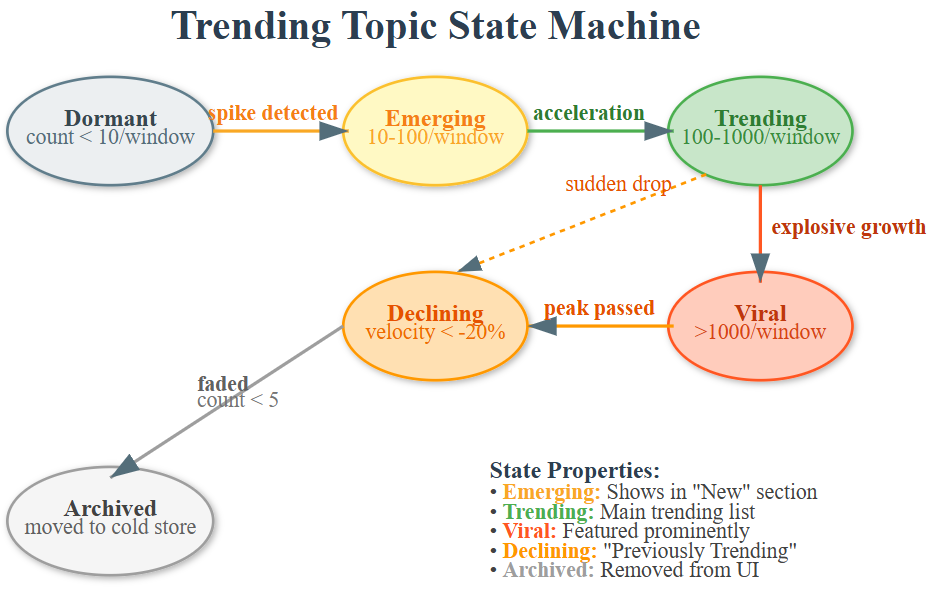
“count”: 47,
“velocity”: 12,
“trend”: “up”
},
{
“hashtag”: “machinelearning”,
“count”: 38,
“velocity”: 8,
“trend”: “up”
}
]
}Key Observations:
count: Total mentions across last 3 windows (15 minutes)
velocity: Rate of change (recent windows vs older windows)
trend: Direction based on velocity
Phase 6: Querying Specific Hashtags
Step 10: Deep Dive into Specific Hashtag
bash
curl http://localhost:8080/api/trending/ai | jqExpected Response:
json
{
  “hashtag”: “ai”,
  “stats”: {
    “windows”: [
      {”window”: 1700000000000, “count”: 15, “timestamp”: 1700000000000},
      {”window”: 1700000300000, “count”: 18, “timestamp”: 1700000300000},
      {”window”: 1700000600000, “count”: 14, “timestamp”: 1700000600000}
    ],
    “total_count”: 47,
    “average”: 15.67
  }
}
Insight: Each window is independently queryable. You can see trending trajectory over time.
Phase 7: Real-Time Dashboard
Step 11: Access Live Dashboard
Open browser:
http://localhost:8080/web/dashboard.htmlFeatures:
Top Trending List: Real-time updates every 5 seconds via WebSocket
Bar Chart: Visual representation of mention counts
System Metrics: Total topics, mentions, update time
How it works:
Dashboard connects via Socket.IO
Server broadcasts updates every 5 seconds
Updates query all instances (local + remote)
Chart and list refresh automatically
Let generator run: Watch dashboard update in real-time as new posts arrive.
Phase 8: Multi-Instance Deployment (Advanced)
Concept: Horizontal Scaling
One instance handles all partitions. Two instances split partitions.
Instance 1: Partitions 0,1 Instance 2: Partitions 2,3
Query for hashtag “ai” → might be on Instance 1 OR Instance 2 OR both!
Step 12: Launch Second Instance
New terminal:
bash
source venv/bin/activate
python src/main.py 1
Expected Output:
[Instance 1] Started processing on port 8081
Starting API server on port 8081...
Step 13: Query Metadata to See Cluster
bash
curl http://localhost:8080/api/metadata | jqExpected Response:
json
{
  “instances”: [
    {”instance_id”: 0, “port”: 8080, “state”: “RUNNING”},
    {”instance_id”: 1, “port”: 8081, “state”: “RUNNING”}
  ],
  “total_instances”: 2
}
Key Point: Instances discover each other. When querying, Instance 0 will automatically RPC to Instance 1 for its partition data.
Phase 9: Testing & Validation
Step 14: Run Automated Tests
bash
./run_tests.shTest Coverage:
✓ Health endpoint returns correct metadata
✓ Trending endpoint returns valid structure
✓ Posts with hashtags appear in trending results
✓ Specific hashtag queries work correctly
✓ Metadata shows all instances
Expected Output:
tests/test_interactive_queries.py::test_api_health PASSED
tests/test_interactive_queries.py::test_trending_endpoint PASSED
tests/test_interactive_queries.py::test_query_with_posts PASSED
tests/test_interactive_queries.py::test_specific_hashtag_query PASSED
tests/test_interactive_queries.py::test_metadata_endpoint PASSED

5 passed in 12.34s
Phase 10: Performance Analysis
Step 15: Measure Query Latency
bash
# Benchmark trending endpoint
for i in {1..10}; do
  time curl -s http://localhost:8080/api/trending > /dev/null
done
Expected: Sub-50ms response times
Why so fast?
Data is in-memory (RocksDB)
No network DB calls
Local reads are pointer lookups
Remote RPC only for other partitions
Step 16: Monitor State Store Size
bash
du -sh data/state-stores/Typical Size: 1-10 MB for thousands of hashtags
Retention Impact: With 1-hour retention and 5-minute windows, you maintain 12 windows × hashtags × count_size
Production Deployment Patterns
Docker Deployment
Build image:
bash
docker build -t streamsocial-trending:latest .Run with configuration:
bash
docker run -e INSTANCE_ID=0 \
           -e KAFKA_BOOTSTRAP=kafka:9092 \
           -e PORT=8080 \
           -p 8080:8080 \
           streamsocial-trending:latest
Kubernetes StatefulSet
Why StatefulSet? State stores need persistent volumes. Pods need stable network identity for peer discovery.
Key Configuration:
yaml
kind: StatefulSet
metadata:
  name: trending-api
spec:
  serviceName: trending
  replicas: 3
  volumeClaimTemplates:
    - metadata:
        name: state-store
      spec:
        accessModes: [”ReadWriteOnce”]
        resources:
          requests:
            storage: 10Gi
Load Balancer Strategy
Problem: Client calls load balancer → random instance → might not have requested data
Solution 1: Smart routing - hash key to instance Solution 2: Query all instances (what we implemented) Solution 3: Use standby replicas for read scaling
Success Criteria
You’ll know it’s working when:
POST to
/api/postswith hashtags → see trending API update within secondsDashboard shows live trending topics refreshing automatically
Querying specific hashtag shows accurate window counts
Starting multiple instances → each serves queries for their partitions
Stopping one instance → others take over its traffic seamlessly
Working Code Demo:
Common Issues & Solutions
Issue: “No trending topics” after generating posts
Cause: Processing lag or window hasn’t closed yet Solution: Wait 5-10 seconds for window to accumulate Debug: Check logs: tail -f logs/instance1.log
Issue: Remote instance query fails
Cause: Network timeout or peer not running Solution: Verify both instances running with ./api/metadata Fallback: System still works with local state only
Issue: State store corruption
Cause: Improper shutdown or disk full Solution: Delete data/state-stores/* and restart (state rebuilds from changelog)
Key Takeaways
Interactive Queries = Direct State Access: No separate database layer
WindowStore = Time-Series Data: Efficient storage and querying of windowed aggregations
Distributed Queries = RPC + Merge: Each instance serves its partitions, coordinator merges
Real-Time = Sub-Second Latency: In-memory reads enable live dashboards
Horizontal Scaling = Partition Distribution: More instances = more throughput
The power of Interactive Queries: your streaming application IS your database. State that drives processing is the same state that answers queries—zero synchronization lag, perfect consistency.
Assignment: Multi-Region Trending Analysis
Extend the trending API to support geographical segmentation:
Challenge: Build trending topics per region
Add region field to posts (US-East, EU-West, Asia-Pacific)
Create separate WindowStores per region
Add
/api/trending?region=US-EastendpointDashboard shows side-by-side comparison
Bonus: Implement “emerging trends” detection
Calculate velocity (rate of change) not just absolute counts
Identify hashtags that are accelerating
Add
/api/emergingendpointVisual indicator on dashboard for emerging topics
Hints:
Use composite keys:
region:hashtagin state storeMaintain separate topology branches per region
Store historical windows for velocity calculation
Consider using SessionStore for burst detection
Solution Approach for Assignment
Geographical Segmentation:
Modify key structure: Instead of
hashtagas key, useregion:hashtagUpdate extraction logic to include region field from post metadata
Query filtering: When querying store, prefix all keys with
region:Aggregation: Iterate over store filtering by region prefix
Emerging Trends Detection:
Store at least 3 window snapshots (15 minutes of data)
Calculate rate:
(current_count - previous_count) / time_deltaRank by velocity, not absolute count
Threshold: Only show if velocity > 2x standard deviation
Implementation Pattern:
# Composite key approach
key = f”{post.region}:{hashtag}”
store.put(key, count)

# Query with region filter
def get_regional_trends(region):
    prefix = f”{region}:”
    return [k for k in store.all() if k.startswith(prefix)]
The key insight: state stores are just key-value maps. By encoding dimensions into keys, you can filter and segment without changing topology structure.
What’s Next
Tomorrow (Day 49) we’ll stress-test everything by simulating failures. We’ll kill application instances, corrupt state stores, and watch Kafka Streams recover automatically. You’ll learn about changelog topics, state restoration, and building truly resilient systems that survive disasters.
Interactive queries are powerful, but they’re only useful if your state survives crashes. Tomorrow, we make our trending API bulletproof.